Statistics
Basic Terms
Class limits : Suppose mark obtained by all of the students are divided into class intervals 25 – 35, 35 – 45 and so interval on.
In class interval 25 – 35, 25 is called lower class limit and 35 is called upper class limit.
Class size : The difference between upper and lower class limit.
Class mark : It is given by
Ungrouped and Grouped Data
The data obtained in original form are called raw data or ungrouped data.
To put the data in a more condensed form, we make groups of suitable size, and mention the frequency of each group. Such a table is called grouped data.
Mean
For Ungrouped:
Consider ‘n’ observations in ungrouped data as : x1, x2, x3, …. xn. The mean of these observations is:![]()
(i) Direct method:
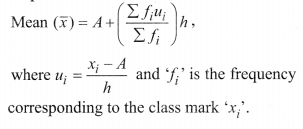
where ‘fi‘ is the frequency corresponding to the class mark ‘xi‘
(ii) Assumed mean method:
Where A is assumed mean and di = xi – A
(iii) step deviation method:
Mode
(i) For Ungrouped Data:
The mode is that observation which occurs most frequently, i.e., an observation with maximum frequency.
(ii) For Grouped Data:
l =lower limit of the modal class,
f1 = frequency of the modal class
f 2 = frequency of the class suceeding the modal class,
h = size of the class interval,
f0 = frequency of the class preceeding the modal class.
The class with the maximum frequency is called modal class.
Median
Median is a measure of central tendency which gives the value of the middle-most observation in the data.
(i) For Ungrouped Data:
Arrange the data in ascending order.
If number of data n is odd, then the median is
If number of data n is even, then the median is the average of
(ii) For Grouped Data:
l = lower limit of the median class,
c.f = cumulative frequency of the class proceeding the median class,
f = frequency of the median class,
h = class size,
n = number of observations.
The class whose cumulative frequency is greater than (and nearest to)
Relationship Between Mean, Mode and Median
3 Median = Mode + 2 Mean
Cumulative Frequency Curve (Ogive)
(i) The smooth free hand curve is formed by joining the points (xi, fi) where x; is the upper limit of a class and f is the corresponding c.f. The curve so obtained is called a cumulative frequency curve, or an ogive of the less than type.
(ii) The smooth free hand curve is formed by joining the points (xi, fi) where Xi is the lower limit of a class and f is the corresponding c.f. The curve so obtained is called a cumulative frequency curve, or an ogive of the more than type.
Median by Graph
(i) Draw the ogive of the less than type and ogive of the more than type on the same axis. The two ogives will intersect each other at a point. From this point, if we draw a perpendicular on the x-axis, the point at which it cuts the x-axis gives us the median.
(ii) Draw the ogive of the less than type, then locate
From this point on y-axis, draw a line parallel to x-axis cutting the less than ogive at a point. From this point draw a perpendicular on the x-axis, the point at which the perpendicular cuts the x-axis gives us the median.
No comments:
Post a Comment