Sunday 30 January 2022

Ch:14 Statistics


Statistics 

Basic Terms

Class limits : Suppose mark obtained by all of the students are divided into class intervals 25 – 35, 35 – 45 and so interval on.
In class interval 25 – 35, 25 is called lower class limit and 35 is called upper class limit.
Class size : The difference between upper and lower class limit.
Class mark : It is given by
NCERT Solutions For Class 10 Maths Chapter 14 Statistics Ex 14.1 Mind Map 1

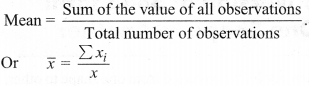
Ungrouped and Grouped Data

The data obtained in original form are called raw data or ungrouped data.
To put the data in a more condensed form, we make groups of suitable size, and mention the frequency of each group. Such a table is called grouped data.

Mean

For Ungrouped:
Consider ‘n’ observations in ungrouped data as : x1, x2, x3, …. xn. The mean of these observations is:
NCERT Solutions For Class 10 Maths Chapter 14 Statistics Ex 14.1 Mind Map 2
(i) Direct method:
NCERT Solutions For Class 10 Maths Chapter 14 Statistics Ex 14.1 Mind Map 3
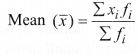
where ‘fi‘ is the frequency corresponding to the class mark ‘xi
(ii) Assumed mean method:
NCERT Solutions For Class 10 Maths Chapter 14 Statistics Ex 14.1 Mind Map 4
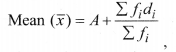
Where A is assumed mean and di = xi – A
(iii) step deviation method:
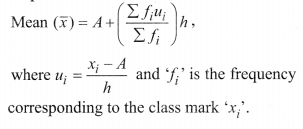
NCERT Solutions For Class 10 Maths Chapter 14 Statistics Ex 14.1 Mind Map 5

Mode

(i) For Ungrouped Data:
The mode is that observation which occurs most frequently, i.e., an observation with maximum frequency.
(ii) For Grouped Data:
NCERT Solutions For Class 10 Maths Chapter 14 Statistics Ex 14.1 Mind Map 6
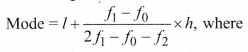
l =lower limit of the modal class,
f1 = frequency of the modal class
2 = frequency of the class suceeding the modal class,
h = size of the class interval,
f0 = frequency of the class preceeding the modal class.
The class with the maximum frequency is called modal class.

Median

Median is a measure of central tendency which gives the value of the middle-most observation in the data.
(i) For Ungrouped Data:
Arrange the data in ascending order.
If number of data n is odd, then the median is (n+12)th observation.
If number of data n is even, then the median is the average of (n2)th and (n2+1)th observations.

(ii) For Grouped Data:
NCERT Solutions For Class 10 Maths Chapter 14 Statistics Ex 14.1 Mind Map 7
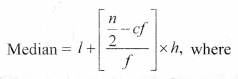
l = lower limit of the median class,
c.f = cumulative frequency of the class proceeding the median class,
f = frequency of the median class,
h = class size,
n = number of observations.
The class whose cumulative frequency is greater than (and nearest to) n2 is called median class.

Relationship Between Mean, Mode and Median
3 Median = Mode + 2 Mean

Cumulative Frequency Curve (Ogive)

(i) The smooth free hand curve is formed by joining the points (xi, fi) where x; is the upper limit of a class and f is the corresponding c.f. The curve so obtained is called a cumulative frequency curve, or an ogive of the less than type.
(ii) The smooth free hand curve is formed by joining the points (xi, fi) where Xi is the lower limit of a class and f is the corresponding c.f. The curve so obtained is called a cumulative frequency curve, or an ogive of the more than type.

Median by Graph

(i) Draw the ogive of the less than type and ogive of the more than type on the same axis. The two ogives will intersect each other at a point. From this point, if we draw a perpendicular on the x-axis, the point at which it cuts the x-axis gives us the median.
(ii) Draw the ogive of the less than type, then locate n2 on the y-axis (n = number of observations).

From this point on y-axis, draw a line parallel to x-axis cutting the less than ogive at a point. From this point draw a perpendicular on the x-axis, the point at which the perpendicular cuts the x-axis gives us the median.

Ch-13 Surface Area and Volume

Surface Areas and Volumes Mind Maps

Surface Areas and Volumes of Solids

(i) Cuboid:

NCERT Solutions for Class 10 Maths Chapter 13 Surface Areas and Volumes Ex 13.1 Mind Map 1
Volume = l × b × h
Total surface area = 2 [lb + bh + hl]
Lateral surface area = 2 [bh + hl]
Diagonal of the coboid = â„“2+b2+h2

(ii) Cube:

NCERT Solutions for Class 10 Maths Chapter 13 Surface Areas and Volumes Ex 13.1 Mind Map 2
Volume = a3
Total surface area = 6a2
Lateral surface area = 4a2
Diagonal of a cube = √3a

(iii) Cylinder:

NCERT Solutions for Class 10 Maths Chapter 13 Surface Areas and Volumes Ex 13.1 Mind Map 3

(a) Right circular cylinder:

NCERT Solutions for Class 10 Maths Chapter 13 Surface Areas and Volumes Ex 13.1 Mind Map 4
Volume = πr2h
Curved Surface Area = 2nrh
Total Surface Area= 2Ï€rh + 2Ï€r2 = 2Ï€r(r + h)

(b) Right circular hollow cylinder:

NCERT Solutions for Class 10 Maths Chapter 13 Surface Areas and Volumes Ex 13.1 Mind Map 5
Let r and R be internal & external radii.
Volume = n(R2 – r2)h
Curved Surface Area = 2Ï€(R + r)h
Total Surface Area = 2Ï€(R + r)h + 2Ï€(R2 – r2)
= 2Ï€(R + r)(h + R — r)

(iv) Right circular cone:

Slant height, l = r2+h2
NCERT Solutions for Class 10 Maths Chapter 13 Surface Areas and Volumes Ex 13.1 Mind Map 6
Volume = 13Ï€r2h
Curved Surface Area = πrl
Total Surface Area = πrl + πr2

Surface Areas and Volumes of Sphere and Hemisphere

(i) Sphere:

NCERT Solutions for Class 10 Maths Chapter 13 Surface Areas and Volumes Ex 13.1 Mind Map 7
Volume = 43r3
Surface area =4Ï€r2

(ii) Hemisphere:

NCERT Solutions for Class 10 Maths Chapter 13 Surface Areas and Volumes Ex 13.1 Mind Map 8
Volume = 23r3
C.S.A = 2Ï€r2
T.S.A = 3Ï€r2

(iii) Hemispherical shell:

NCERT Solutions for Class 10 Maths Chapter 13 Surface Areas and Volumes Ex 13.1 Mind Map 9
Volume = 23Ï€(R3r3)
Curved Surface Area = 2Ï€(R2 + r2)
Total Surface Area = 2Ï€(r2 + R2) + n (R2 – r2)
= Ï€ (r2 + 3R2)

Surface Areas of a Combination of Solids

The surface area of a solid which is a combination of two or more solids is calculated by adding the surface areas of the individual solids which are visible in the new solid formed.
For Example:
NCERT Solutions for Class 10 Maths Chapter 13 Surface Areas and Volumes Ex 13.1 Mind Map 10
If we consider the surface of the newly formed object as given in the figure above, we would be able to see only the curved surfaces of the two hemispheres and the curved surface of the cylinder.
So, the total surface area of the new solid is the sum of the curved surface areas of each of the individual parts. This gives, TSA of new solid = CSA of one hemisphere + CSA of cylinder + CSA of other hemisphere

Volume of a Combination of Solids

Whenever solid is formed by combining two or more solids, then the amount of matter present in the new solid is equal to the sum of amounts of matter in the constituting solids. Volume of new solid = sum of the volumes of the individual solids

Conversion of Solid form One Shape to Another

(i) When a solid is converted from one shape to other, then its volume remains same only its shape and size changes.
(ii) If a solid is converted into a number of small identical solids, then Number of small items
NCERT Solutions for Class 10 Maths Chapter 13 Surface Areas and Volumes Ex 13.1 Mind Map 11

Frustum of a Cone [Very Important for Board Exam]

When we slice (or cut) through a cone with a plane parallel to its base (see below figure ) and remove the cone that is formed on one side of that plane, the part that is now left over on the other side of the plane is called a frustum of the cone.
NCERT Solutions for Class 10 Maths Chapter 13 Surface Areas and Volumes Ex 13.1 Mind Map 12
(i) Volume of the frustum of cone 13Ï€h(r21+r22+r1r2)
(ii) C.S.A. of the frustum of cone = Ï€(r1 + r2)l,
NCERT Solutions for Class 10 Maths Chapter 13 Surface Areas and Volumes Ex 13.1 Mind Map 13
where l =  h2+(r1r2)2

iii) T.S.A. of the frustum of cone
l = h2+(r1r2)2 h2+(r1r2)2

Ch:14 Statistics

  Statistics  Basic Terms Class limits  : Suppose mark obtained by all of the students are divided into class intervals 25 – 35, 35 – 45 and...